|
700
|
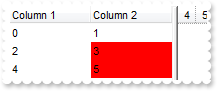
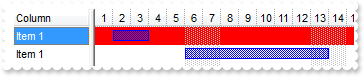
Is it possible to colour a particular column for specified values
with AxGantt1 do
begin
	BeginUpdate();
	with ConditionalFormats.Add('int(%1) in (3,4,5)',Nil) do
	begin
		BackColor := $ff;
		ApplyTo := EXGANTTLib.FormatApplyToEnum($1);
	end;
	MarkSearchColumn := False;
	with Columns do
	begin
		Add('Column 1');
		Add('Column 2');
	end;
	with Items do
	begin
		CellCaption[TObject(AddItem(TObject(0))),TObject(1)] := TObject(1);
		CellCaption[TObject(AddItem(TObject(2))),TObject(1)] := TObject(3);
		CellCaption[TObject(AddItem(TObject(4))),TObject(1)] := TObject(5);
	end;
	EndUpdate();
end
|
|
699
|
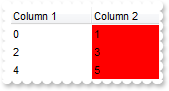
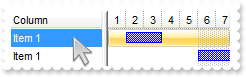
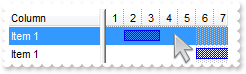
Is it possible to colour a particular column
with AxGantt1 do
begin
	BeginUpdate();
	MarkSearchColumn := False;
	with Columns do
	begin
		Add('Column 1');
		(Add('Column 2') as EXGANTTLib.Column).Def[EXGANTTLib.DefColumnEnum.exCellBackColor] := TObject(255);
	end;
	with Items do
	begin
		CellCaption[TObject(AddItem(TObject(0))),TObject(1)] := TObject(1);
		CellCaption[TObject(AddItem(TObject(2))),TObject(1)] := TObject(3);
		CellCaption[TObject(AddItem(TObject(4))),TObject(1)] := TObject(5);
	end;
	EndUpdate();
end
|
|
698
|
How do i get all the children items that are under a certain parent Item handle
with AxGantt1 do
begin
	BeginUpdate();
	LinesAtRoot := EXGANTTLib.LinesAtRootEnum.exLinesAtRoot;
	Columns.Add('P');
	with Items do
	begin
		h := AddItem('Root');
		InsertItem(h,Nil,'Child 1');
		InsertItem(h,Nil,'Child 2');
		ExpandItem[h] := True;
	end;
	with Items do
	begin
		hChild := ItemChild[FirstVisibleItem];
		OutputDebugString( CellCaption[TObject(hChild),TObject(0)] );
		OutputDebugString( CellCaption[TObject(NextSiblingItem[hChild]),TObject(0)] );
	end;
	EndUpdate();
end
|
|
697
|
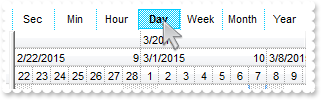
How can I change the predefined labels being displayed in the chart's header so it shows the data in short format with no literals
with AxGantt1 do
begin
	BeginUpdate();
	with Chart do
	begin
		PaneWidth[False] := 0;
		LevelCount := 3;
		OverviewVisible := EXGANTTLib.OverviewVisibleEnum.exOverviewShowAll;
		AllowOverviewZoom := EXGANTTLib.OverviewZoomEnum.exAlwaysZoom;
		Label[EXGANTTLib.UnitEnum.exYear] := '<%yy%><|><%yyyy%>';
		Label[EXGANTTLib.UnitEnum.exHalfYear] := '';
		Label[EXGANTTLib.UnitEnum.exQuarterYear] := '';
		Label[EXGANTTLib.UnitEnum.exMonth] := '<|><%m%><|><%m%>/<%yy%><|><%m%>/<%yyyy%>';
		Label[EXGANTTLib.UnitEnum.exThirdMonth] := '';
		Label[EXGANTTLib.UnitEnum.exWeek] := '<|><%ww%><|><%m%>/<%d%>/<%yy%><r><%ww%><|><%m%>/<%d%>/<%yyyy%><r><%ww%><||><||>256';
		Label[EXGANTTLib.UnitEnum.exDay] := '<|><%d%><|><%m%>/<%d%>/<%yy%><|><%m%>/<%d%>/<%yyyy%><||><||>4096';
		Label[EXGANTTLib.UnitEnum.exHour] := '<|><%hh%><|><%m%>/<%d%>/<%yy%> <%h%> <%AM/PM%><|><%m%>/<%d%>/<%yyyy%> <%h%> <%AM/PM%><||><||>65536';
		Label[EXGANTTLib.UnitEnum.exMinute] := '<|><%nn%><|><%h%>:<%nn% <%AM/PM%>><|><%m%>/<%d%>/<%yy%> <%h%>:<%nn%> <%AM/PM%><|><%m%>/<%d%>/<%yyyy%> <%h%>:<%nn%> <%AM/PM%>';
		Label[EXGANTTLib.UnitEnum.exSecond] := '<|><%ss%><|><%nn%>:<%ss%><|><%h%>:<%nn%>:<%ss%> <%AM/PM%><|><%m%>/<%d%>/<%yy%> <%h%>:<%nn%>:<%ss%> <%AM/PM%><|><%m%>/<%d%>/<%yyy' +
	'y%> <%h%>:<%nn%>:<%ss%> <%AM/PM%>';
		LabelToolTip[EXGANTTLib.UnitEnum.exYear] := '<%yyyy%>';
		LabelToolTip[EXGANTTLib.UnitEnum.exHalfYear] := '';
		LabelToolTip[EXGANTTLib.UnitEnum.exQuarterYear] := '';
		LabelToolTip[EXGANTTLib.UnitEnum.exMonth] := '<%m%>/<%yyyy%>';
		LabelToolTip[EXGANTTLib.UnitEnum.exThirdMonth] := '';
		LabelToolTip[EXGANTTLib.UnitEnum.exWeek] := '<%m%>/<%d%>/<%yyyy%> <%ww%>';
		LabelToolTip[EXGANTTLib.UnitEnum.exDay] := '<%m%>/<%d%>/<%yyyy%>';
		LabelToolTip[EXGANTTLib.UnitEnum.exHour] := '<%m%>/<%d%>/<%yyyy%> <%h%> <%AM/PM%>';
		LabelToolTip[EXGANTTLib.UnitEnum.exMinute] := '<%m%>/<%d%>/<%yyyy%> <%h%>:<%nn%> <%AM/PM%>';
		LabelToolTip[EXGANTTLib.UnitEnum.exSecond] := '<%m%>/<%d%>/<%yyyy%> <%h%>:<%nn%>:<%ss%> <%AM/PM%>';
		UnitScale := EXGANTTLib.UnitEnum.exDay;
	end;
	EndUpdate();
end
|
|
696
|
How can I get the caption of focused item
// SelectionChanged event - Fired after a new item has been selected.
procedure TWinForm1.AxGantt1_SelectionChanged(sender: System.Object; e: System.EventArgs);
begin
	with AxGantt1 do
	begin
		with Items do
		begin
			OutputDebugString( 'Handle' );
			OutputDebugString( FocusItem );
			OutputDebugString( 'Caption' );
			OutputDebugString( CellCaption[TObject(FocusItem),TObject(0)] );
		end;
	end
end;

with AxGantt1 do
begin
	BeginUpdate();
	LinesAtRoot := EXGANTTLib.LinesAtRootEnum.exLinesAtRoot;
	Columns.Add('Items');
	with Items do
	begin
		h := AddItem('R1');
		InsertItem(h,Nil,'Cell 1.1');
		InsertItem(h,Nil,'Cell 1.2');
		ExpandItem[h] := True;
		h := AddItem('R2');
		InsertItem(h,Nil,'Cell 2.1');
		InsertItem(h,Nil,'Cell 2.2');
		ExpandItem[h] := True;
	end;
	EndUpdate();
end
|
|
695
|
How can I get the caption of selected item
// SelectionChanged event - Fired after a new item has been selected.
procedure TWinForm1.AxGantt1_SelectionChanged(sender: System.Object; e: System.EventArgs);
begin
	with AxGantt1 do
	begin
		with Items do
		begin
			OutputDebugString( 'Handle' );
			OutputDebugString( SelectedItem[0] );
			OutputDebugString( 'Caption' );
			OutputDebugString( CellCaption[TObject(SelectedItem[0]),TObject(0)] );
		end;
	end
end;

with AxGantt1 do
begin
	BeginUpdate();
	LinesAtRoot := EXGANTTLib.LinesAtRootEnum.exLinesAtRoot;
	Columns.Add('Items');
	with Items do
	begin
		h := AddItem('R1');
		InsertItem(h,Nil,'Cell 1.1');
		InsertItem(h,Nil,'Cell 1.2');
		ExpandItem[h] := True;
		h := AddItem('R2');
		InsertItem(h,Nil,'Cell 2.1');
		InsertItem(h,Nil,'Cell 2.2');
		ExpandItem[h] := True;
	end;
	EndUpdate();
end
|
|
694
|
How can I highligth the item from the cursor as it moves
// MouseMove event - Occurs when the user moves the mouse.
procedure TWinForm1.AxGantt1_MouseMoveEvent(sender: System.Object; e: AxEXGANTTLib._IGanttEvents_MouseMoveEvent);
begin
	with AxGantt1 do
	begin
		BeginUpdate();
		h := get_ItemFromPoint(-1,-1,c,hit);
		with Items do
		begin
			ClearItemBackColor(AxGantt1.Background[EXGANTTLib.BackgroundPartEnum($200 Or Integer(EXGANTTLib.BackgroundPartEnum.exHSRight) Or Integer(EXGANTTLib.BackgroundPartEnum.exListOLEDropPosition))]);
			ItemBackColor[h] := $f0faf0;
		end;
		set_Background(EXGANTTLib.BackgroundPartEnum($200 Or Integer(EXGANTTLib.BackgroundPartEnum.exHSRight) Or Integer(EXGANTTLib.BackgroundPartEnum.exListOLEDropPosition)),h);
		EndUpdate();
	end
end;

with AxGantt1 do
begin
	BeginUpdate();
	LinesAtRoot := EXGANTTLib.LinesAtRootEnum.exLinesAtRoot;
	DrawGridLines := EXGANTTLib.GridLinesEnum.exHLines;
	SelBackColor := Color.FromArgb(240,250,240);
	SelForeColor := Color.FromArgb(0,0,0);
	ShowFocusRect := False;
	with Chart do
	begin
		SelBackColor := $f0faf0;
	end;
	Columns.Add('Items');
	with Items do
	begin
		h := AddItem('R1');
		InsertItem(h,Nil,'Cell 1.1');
		InsertItem(h,Nil,'Cell 1.2');
		ExpandItem[h] := True;
		h := AddItem('R2');
		InsertItem(h,Nil,'Cell 2.1');
		InsertItem(h,Nil,'Cell 2.2');
		ExpandItem[h] := True;
	end;
	EndUpdate();
end
|
|
693
|
How can I get the item from the cursor
// MouseMove event - Occurs when the user moves the mouse.
procedure TWinForm1.AxGantt1_MouseMoveEvent(sender: System.Object; e: AxEXGANTTLib._IGanttEvents_MouseMoveEvent);
begin
	with AxGantt1 do
	begin
		h := get_ItemFromPoint(-1,-1,c,hit);
		OutputDebugString( 'Handle' );
		OutputDebugString( h );
		OutputDebugString( 'Index' );
		OutputDebugString( Items.ItemToIndex[h] );
	end
end;

with AxGantt1 do
begin
	BeginUpdate();
	LinesAtRoot := EXGANTTLib.LinesAtRootEnum.exLinesAtRoot;
	DrawGridLines := EXGANTTLib.GridLinesEnum.exHLines;
	Columns.Add('Items');
	with Items do
	begin
		h := AddItem('R1');
		InsertItem(h,Nil,'Cell 1.1');
		InsertItem(h,Nil,'Cell 1.2');
		ExpandItem[h] := True;
		h := AddItem('R2');
		InsertItem(h,Nil,'Cell 2.1');
		InsertItem(h,Nil,'Cell 2.2');
		ExpandItem[h] := True;
	end;
	EndUpdate();
end
|
|
692
|
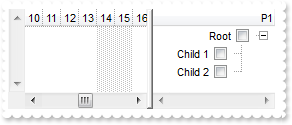
How can I get the column from the cursor, not only in the header
// MouseMove event - Occurs when the user moves the mouse.
procedure TWinForm1.AxGantt1_MouseMoveEvent(sender: System.Object; e: AxEXGANTTLib._IGanttEvents_MouseMoveEvent);
begin
	with AxGantt1 do
	begin
		OutputDebugString( get_ColumnFromPoint(-1,0) );
	end
end;

with AxGantt1 do
begin
	BeginUpdate();
	LinesAtRoot := EXGANTTLib.LinesAtRootEnum.exLinesAtRoot;
	Columns.Add('P1');
	Columns.Add('P2');
	DrawGridLines := EXGANTTLib.GridLinesEnum.exAllLines;
	with Items do
	begin
		h := AddItem('R1');
		CellCaption[TObject(h),TObject(1)] := 'R2';
		CellCaption[TObject(InsertItem(h,Nil,'Cell 1.1')),TObject(1)] := 'Cell 1.2';
		CellCaption[TObject(InsertItem(h,Nil,'Cell 2.1')),TObject(1)] := 'Cell 2.2';
		ExpandItem[h] := True;
	end;
	EndUpdate();
end
|
|
691
|
How can I get the column from the cursor
// MouseMove event - Occurs when the user moves the mouse.
procedure TWinForm1.AxGantt1_MouseMoveEvent(sender: System.Object; e: AxEXGANTTLib._IGanttEvents_MouseMoveEvent);
begin
	with AxGantt1 do
	begin
		OutputDebugString( get_ColumnFromPoint(-1,-1) );
	end
end;

with AxGantt1 do
begin
	BeginUpdate();
	LinesAtRoot := EXGANTTLib.LinesAtRootEnum.exLinesAtRoot;
	DrawGridLines := EXGANTTLib.GridLinesEnum.exAllLines;
	Columns.Add('P1');
	Columns.Add('P2');
	with Items do
	begin
		h := AddItem('R1');
		CellCaption[TObject(h),TObject(1)] := 'R2';
		CellCaption[TObject(InsertItem(h,Nil,'Cell 1.1')),TObject(1)] := 'Cell 1.2';
		CellCaption[TObject(InsertItem(h,Nil,'Cell 2.1')),TObject(1)] := 'Cell 2.2';
		ExpandItem[h] := True;
	end;
	EndUpdate();
end
|
|
690
|
How can I get the cell's caption from the cursor
// MouseMove event - Occurs when the user moves the mouse.
procedure TWinForm1.AxGantt1_MouseMoveEvent(sender: System.Object; e: AxEXGANTTLib._IGanttEvents_MouseMoveEvent);
begin
	with AxGantt1 do
	begin
		h := get_ItemFromPoint(-1,-1,c,hit);
		OutputDebugString( Items.CellCaption[TObject(h),TObject(c)] );
	end
end;

with AxGantt1 do
begin
	BeginUpdate();
	LinesAtRoot := EXGANTTLib.LinesAtRootEnum.exLinesAtRoot;
	Columns.Add('Items');
	with Items do
	begin
		h := AddItem('R1');
		InsertItem(h,Nil,'Cell 1.1');
		InsertItem(h,Nil,'Cell 1.2');
		ExpandItem[h] := True;
		h := AddItem('R2');
		InsertItem(h,Nil,'Cell 2.1');
		InsertItem(h,Nil,'Cell 2.2');
		ExpandItem[h] := True;
	end;
	EndUpdate();
end
|
|
689
|
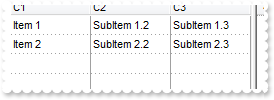
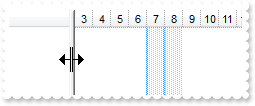
Is it possible to change the style for the vertical or horizontal grid lines, in the list area
with AxGantt1 do
begin
	BeginUpdate();
	DrawGridLines := EXGANTTLib.GridLinesEnum.exAllLines;
	GridLineStyle := Integer(EXGANTTLib.GridLinesStyleEnum.exGridLinesVSolid) Or Integer(EXGANTTLib.GridLinesStyleEnum.exGridLinesHDot4);
	Columns.Add('C1');
	Columns.Add('C2');
	Columns.Add('C3');
	with Items do
	begin
		h := AddItem('Item 1');
		CellCaption[TObject(h),TObject(1)] := 'SubItem 1.2';
		CellCaption[TObject(h),TObject(2)] := 'SubItem 1.3';
		h := AddItem('Item 2');
		CellCaption[TObject(h),TObject(1)] := 'SubItem 2.2';
		CellCaption[TObject(h),TObject(2)] := 'SubItem 2.3';
	end;
	EndUpdate();
end
|
|
688
|
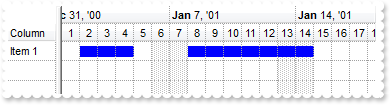
How can I show the bars over the grid lines, i.e. so you cannot see the grid lines 'through' the bar
with AxGantt1 do
begin
	BeginUpdate();
	DrawGridLines := EXGANTTLib.GridLinesEnum.exAllLines;
	GridLineColor := Color.FromArgb(220,220,220);
	with Chart do
	begin
		PaneWidth[False] := 48;
		FirstVisibleDate := '1/1/2001';
		DrawGridLines := EXGANTTLib.GridLinesEnum.exAllLines;
		GridLineStyle := EXGANTTLib.GridLinesStyleEnum.exGridLinesBehind;
		LevelCount := 2;
		with Level[1] do
		begin
			DrawGridLines := True;
			GridLineColor := $dcdcdc;
		end;
		with Bars.Item['Task'] do
		begin
			Pattern := EXGANTTLib.PatternEnum.exPatternSolid;
			Height := 14;
		end;
	end;
	Columns.Add('Column');
	with Items do
	begin
		h := AddItem('Item 1');
		AddBar(h,'Task','1/2/2001','1/5/2001','A',Nil);
		AddBar(h,'Task','1/8/2001','1/15/2001','B',Nil);
	end;
	EndUpdate();
end
|
|
687
|
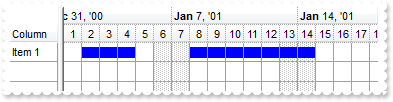
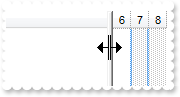
Is it possible to change the style for the vertical grid lines, in the chart area only
with AxGantt1 do
begin
	BeginUpdate();
	DrawGridLines := EXGANTTLib.GridLinesEnum.exAllLines;
	GridLineStyle := EXGANTTLib.GridLinesStyleEnum.exGridLinesDash;
	with Chart do
	begin
		PaneWidth[False] := 48;
		FirstVisibleDate := '1/1/2001';
		DrawGridLines := EXGANTTLib.GridLinesEnum.exAllLines;
		GridLineStyle := EXGANTTLib.GridLinesStyleEnum.exGridLinesDash;
		LevelCount := 2;
		Level[1].DrawGridLines := True;
		with Level[0] do
		begin
			GridLineColor := $ff;
			GridLineStyle := EXGANTTLib.GridLinesStyleEnum.exGridLinesVSolid;
		end;
		Bars.Item['Task'].Pattern := EXGANTTLib.PatternEnum.exPatternSolid;
	end;
	Columns.Add('Column');
	with Items do
	begin
		h := AddItem('Item 1');
		AddBar(h,'Task','1/2/2001','1/5/2001','A',Nil);
		AddBar(h,'Task','1/8/2001','1/15/2001','B',Nil);
	end;
	EndUpdate();
end
|
|
686
|
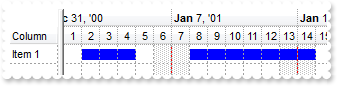
Is it possible to change the style for the grid lines, for instance to be solid not dotted
with AxGantt1 do
begin
	BeginUpdate();
	DrawGridLines := EXGANTTLib.GridLinesEnum.exAllLines;
	GridLineStyle := EXGANTTLib.GridLinesStyleEnum.exGridLinesSolid;
	with Chart do
	begin
		PaneWidth[False] := 48;
		FirstVisibleDate := '1/1/2001';
		DrawGridLines := EXGANTTLib.GridLinesEnum.exAllLines;
		GridLineStyle := EXGANTTLib.GridLinesStyleEnum.exGridLinesSolid;
		LevelCount := 2;
		Level[1].DrawGridLines := True;
		Bars.Item['Task'].Pattern := EXGANTTLib.PatternEnum.exPatternSolid;
	end;
	Columns.Add('Column');
	with Items do
	begin
		h := AddItem('Item 1');
		AddBar(h,'Task','1/2/2001','1/5/2001','A',Nil);
		AddBar(h,'Task','1/8/2001','1/15/2001','B',Nil);
	end;
	EndUpdate();
end
|
|
685
|
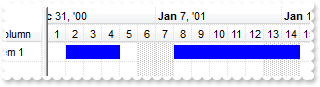
How can I show the grid lines for the chart and list area
with AxGantt1 do
begin
	DrawGridLines := EXGANTTLib.GridLinesEnum.exAllLines;
	with Chart do
	begin
		PaneWidth[False] := 48;
		FirstVisibleDate := '1/1/2001';
		DrawGridLines := EXGANTTLib.GridLinesEnum.exAllLines;
		LevelCount := 2;
		Level[1].DrawGridLines := True;
		Bars.Item['Task'].Pattern := EXGANTTLib.PatternEnum.exPatternSolid;
	end;
	Columns.Add('Column');
	with Items do
	begin
		h := AddItem('Item 1');
		AddBar(h,'Task','1/2/2001','1/5/2001','A',Nil);
		AddBar(h,'Task','1/8/2001','1/15/2001','B',Nil);
	end;
end
|
|
684
|
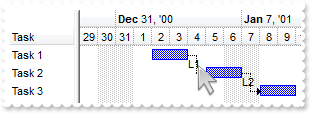
How can I get the link from the point
// MouseMove event - Occurs when the user moves the mouse.
procedure TWinForm1.AxGantt1_MouseMoveEvent(sender: System.Object; e: AxEXGANTTLib._IGanttEvents_MouseMoveEvent);
begin
	with AxGantt1 do
	begin
		OutputDebugString( Chart.LinkFromPoint[-1,-1] );
	end
end;

with AxGantt1 do
begin
	BeginUpdate();
	Columns.Add('Task');
	with Chart do
	begin
		FirstVisibleDate := '12/29/2000';
		PaneWidth[False] := 64;
		LevelCount := 2;
	end;
	with Items do
	begin
		h1 := AddItem('Task 1');
		AddBar(h1,'Task','1/2/2001','1/4/2001','K1',Nil);
		h2 := AddItem('Task 2');
		AddBar(h2,'Task','1/5/2001','1/7/2001','K2',Nil);
		AddLink('L1',h1,'K1',h2,'K2');
		Link['L1',EXGANTTLib.LinkPropertyEnum.exLinkText] := 'L1';
		h3 := AddItem('Task 3');
		AddBar(h3,'Task','1/8/2001','1/10/2001','K3',Nil);
		AddLink('L2',h2,'K2',h3,'K3');
		Link['L2',EXGANTTLib.LinkPropertyEnum.exLinkText] := 'L2';
	end;
	EndUpdate();
end
|
|
683
|
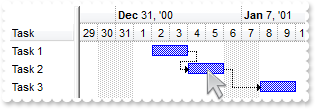
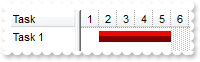
How can I get the bar from the point
// MouseMove event - Occurs when the user moves the mouse.
procedure TWinForm1.AxGantt1_MouseMoveEvent(sender: System.Object; e: AxEXGANTTLib._IGanttEvents_MouseMoveEvent);
begin
	with AxGantt1 do
	begin
		OutputDebugString( Chart.BarFromPoint[-1,-1] );
	end
end;

with AxGantt1 do
begin
	BeginUpdate();
	Columns.Add('Task');
	with Chart do
	begin
		FirstVisibleDate := '12/29/2000';
		PaneWidth[False] := 64;
		LevelCount := 2;
	end;
	with Items do
	begin
		h1 := AddItem('Task 1');
		AddBar(h1,'Task','1/2/2001','1/4/2001','K1',Nil);
		h2 := AddItem('Task 2');
		AddBar(h2,'Task','1/4/2001','1/6/2001','K2',Nil);
		AddLink('L1',h1,'K1',h2,'K2');
		h3 := AddItem('Task 3');
		AddBar(h3,'Task','1/8/2001','1/10/2001','K3',Nil);
		AddLink('L2',h2,'K2',h3,'K3');
	end;
	EndUpdate();
end
|
|
682
|
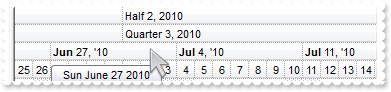
How can I get the level from the cursor
// MouseMove event - Occurs when the user moves the mouse.
procedure TWinForm1.AxGantt1_MouseMoveEvent(sender: System.Object; e: AxEXGANTTLib._IGanttEvents_MouseMoveEvent);
begin
	with AxGantt1 do
	begin
		OutputDebugString( Chart.LevelFromPoint[-1,-1] );
	end
end;

with AxGantt1 do
begin
	with Chart do
	begin
		FirstVisibleDate := '6/25/2010';
		PaneWidth[False] := 0;
		LevelCount := 4;
	end;
end
|
|
681
|
I display numbers in my chart, but the AddBar requires a date how can I add a bar
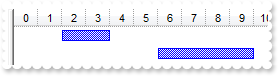
with AxGantt1 do
begin
BeginUpdate();
Columns.Add('Tasks');
with Chart do
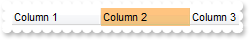
begin
PaneWidth[False] := 0;
NonworkingDays := 0;
FirstVisibleDate := TObject(0);
ToolTip := '';
with Level[0] do
begin
Label := '<%i%>';
ToolTip := '';
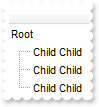
end;
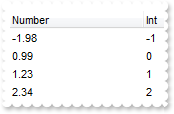
UnitWidth := 24;
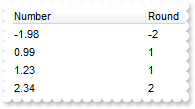
end;
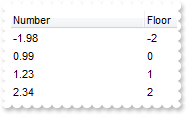
with Items do
begin
AddBar(AddItem('Task 1'),'Task',TObject(2),TObject(4),Nil,Nil);
AddBar(AddItem('Task 2'),'Task',TObject(6),TObject(10),Nil,Nil);
end;
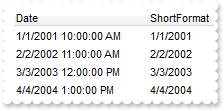
EndUpdate();
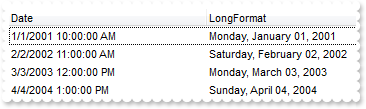
end
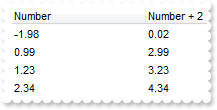
|
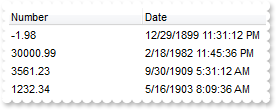
|
680
|
I display numbers in the chart's header but do not want to get displayed negative numbers. How can i do that
// DateChange event - Occurs when the first visible date is changed.
procedure TWinForm1.AxGantt1_DateChange(sender: System.Object; e: System.EventArgs);
begin
	with AxGantt1 do
	begin
		Chart.FirstVisibleDate := TObject(0);
		set_ScrollPartEnable(EXGANTTLib.ScrollBarEnum.exHChartScroll,EXGANTTLib.ScrollPartEnum.exLeftBPart,False);
	end
end;

with AxGantt1 do
begin
	BeginUpdate();
	with Chart do
	begin
		PaneWidth[False] := 0;
		NonworkingDays := 0;
		FirstVisibleDate := TObject(0);
		ToolTip := '';
		with Level[0] do
		begin
			Label := '<%i%>';
			ToolTip := '<%i%>';
		end;
		UnitWidth := 24;
	end;
	EndUpdate();
end
|
|
679
|
How can I display numbers in the chart's header instead dates
with AxGantt1 do
begin
	BeginUpdate();
	with Chart do
	begin
		PaneWidth[False] := 0;
		NonworkingDays := 0;
		FirstVisibleDate := TObject(0);
		ToolTip := '';
		with Level[0] do
		begin
			Label := '<%i%>';
			ToolTip := '';
		end;
		UnitWidth := 24;
	end;
	EndUpdate();
end
|
|
678
|
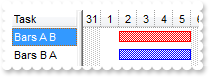
How can I determine that a certain bar is the topmost
with AxGantt1 do
begin
	Columns.Add('Task');
	with Chart do
	begin
		PaneWidth[False] := 48;
		FirstVisibleDate := '12/27/2000';
	end;
	with Items do
	begin
		h := AddItem('Bars A B');
		AddBar(h,'Task','1/2/2001','1/6/2001','A',Nil);
		AddBar(h,'Task','1/2/2001','1/6/2001','B',Nil);
		ItemBar[h,'B',EXGANTTLib.ItemBarPropertyEnum.exBarColor] := TObject(255);
		h := AddItem('Bars B A');
		AddBar(h,'Task','1/2/2001','1/6/2001','B',Nil);
		AddBar(h,'Task','1/2/2001','1/6/2001','A',Nil);
		ItemBar[h,'A',EXGANTTLib.ItemBarPropertyEnum.exBarColor] := TObject(255);
	end;
end
|
|
677
|
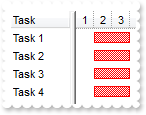
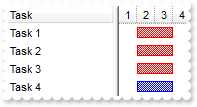
Is there any automatic way to change a property for all bars in the chart
with AxGantt1 do
begin
	Columns.Add('Task');
	Chart.FirstVisibleDate := '1/1/2001';
	with Items do
	begin
		AddBar(AddItem('Task 1'),'Task','1/2/2001','1/4/2001','K1',Nil);
		AddBar(AddItem('Task 2'),'Task','1/2/2001','1/4/2001','K2',Nil);
		AddBar(AddItem('Task 3'),'Task','1/2/2001','1/4/2001','K3',Nil);
		AddBar(AddItem('Task 4'),'Task','1/2/2001','1/4/2001','K4',Nil);
		ItemBar[0,'<*>',EXGANTTLib.ItemBarPropertyEnum.exBarColor] := TObject(255);
	end;
end
|
|
676
|
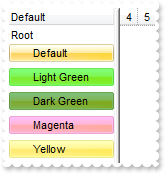
I have an EBN file how can I apply different colors to it, so no need to create a new one
with AxGantt1 do
begin
	VisualAppearance.Add(1,'c:\exontrol\images\normal.ebn');
	SelBackColor := BackColor;
	SelForeColor := ForeColor;
	HasLines := EXGANTTLib.HierarchyLineEnum.exNoLine;
	Columns.Add('Default');
	with Items do
	begin
		h := AddItem('Root');
		hC := InsertItem(h,Nil,'Default');
		ItemBackColor[hC] := $1000000;
		ItemHeight[InsertItem(h,Nil,'')] := 6;
		hC := InsertItem(h,Nil,'Light Green');
		ItemBackColor[hC] := $100ff00;
		ItemHeight[InsertItem(h,Nil,'')] := 6;
		hC := InsertItem(h,Nil,'Dark Green');
		ItemBackColor[hC] := $1007f00;
		ItemHeight[InsertItem(h,Nil,'')] := 6;
		hC := InsertItem(h,Nil,'Magenta');
		ItemBackColor[hC] := $1ff7fff;
		ItemHeight[InsertItem(h,Nil,'')] := 6;
		hC := InsertItem(h,Nil,'Yellow');
		ItemBackColor[hC] := $17fffff;
		ItemHeight[InsertItem(h,Nil,'')] := 6;
		ExpandItem[h] := True;
	end;
end
|
|
675
|
How can I remove all bars from the chart
with AxGantt1 do
begin
	Columns.Add('Task');
	Chart.FirstVisibleDate := '1/1/2001';
	with Items do
	begin
		AddBar(AddItem('Task 1'),'Task','1/2/2001','1/4/2001','K1',Nil);
		AddBar(AddItem('Task 2'),'Task','1/2/2001','1/4/2001','K1',Nil);
		AddBar(AddItem('Task 3'),'Task','1/2/2001','1/4/2001','K1',Nil);
		AddBar(AddItem('Task 4'),'Task','1/2/2001','1/4/2001','K2',Nil);
		ClearBars(0);
	end;
end
|
|
674
|
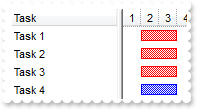
How can I change the color for all bars with a specified key
with AxGantt1 do
begin
	Columns.Add('Task');
	Chart.FirstVisibleDate := '1/1/2001';
	with Items do
	begin
		AddBar(AddItem('Task 1'),'Task','1/2/2001','1/4/2001','K1',Nil);
		AddBar(AddItem('Task 2'),'Task','1/2/2001','1/4/2001','K1',Nil);
		AddBar(AddItem('Task 3'),'Task','1/2/2001','1/4/2001','K1',Nil);
		AddBar(AddItem('Task 4'),'Task','1/2/2001','1/4/2001','K2',Nil);
		ItemBar[0,'K1',EXGANTTLib.ItemBarPropertyEnum.exBarColor] := TObject(255);
	end;
end
|
|
673
|
Is there any automatic way to change a property for all bars with a specified key
with AxGantt1 do
begin
	Columns.Add('Task');
	Chart.FirstVisibleDate := '1/1/2001';
	with Items do
	begin
		AddBar(AddItem('Task 1'),'Task','1/2/2001','1/4/2001','K1',Nil);
		AddBar(AddItem('Task 2'),'Task','1/2/2001','1/4/2001','K1',Nil);
		AddBar(AddItem('Task 3'),'Task','1/2/2001','1/4/2001','K1',Nil);
		AddBar(AddItem('Task 4'),'Task','1/2/2001','1/4/2001','K2',Nil);
		ItemBar[0,'K1',EXGANTTLib.ItemBarPropertyEnum.exBarColor] := TObject(255);
	end;
end
|
|
672
|
How can I remove all bars with specified key
with AxGantt1 do
begin
	Columns.Add('Task');
	Chart.FirstVisibleDate := '1/1/2001';
	with Items do
	begin
		AddBar(AddItem('Task 1'),'Task','1/2/2001','1/4/2001','K1',Nil);
		AddBar(AddItem('Task 2'),'Task','1/2/2001','1/4/2001','K1',Nil);
		AddBar(AddItem('Task 3'),'Task','1/2/2001','1/4/2001','K1',Nil);
		AddBar(AddItem('Task 4'),'Task','1/2/2001','1/4/2001','K2',Nil);
		RemoveBar(0,'K1');
	end;
end
|
|
671
|
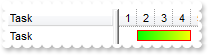
Is there any option to show gradient bars without using EBN technology
with AxGantt1 do
begin
	Columns.Add('Task');
	Chart.FirstVisibleDate := '1/1/2001';
	with Chart.Bars.Item['Task'] do
	begin
		Color := $ff;
		StartColor := $ff00;
		EndColor := $ffff;
		Pattern := EXGANTTLib.PatternEnum.exPatternBox;
	end;
	with Items do
	begin
		h := AddItem('Task');
		AddBar(h,'Task','1/2/2001','1/5/2001','',Nil);
	end;
end
|
|
670
|
How can I disable the control's splitter so the user can't resize the list area
with AxGantt1 do
begin
	OnResizeControl := Integer(EXGANTTLib.OnResizeControlEnum.exDisableSplitter) Or Integer(EXGANTTLib.OnResizeControlEnum.exResizeChart);
	Chart.PaneWidth[False] := 60;
end
|
|
669
|
How can I disable the control's splitter so the user can't resize the chart area
with AxGantt1 do
begin
	OnResizeControl := EXGANTTLib.OnResizeControlEnum.exDisableSplitter;
	Chart.PaneWidth[True] := 60;
end
|
|
668
|
How can I define a bar that shows two colors, one up and one down, without using skin or EBN files
with AxGantt1 do
begin
	BeginUpdate();
	Columns.Add('Task');
	Chart.FirstVisibleDate := '1/1/2001';
	with Chart.Bars.Add('A') do
	begin
		Color := $ff;
		Shape := EXGANTTLib.ShapeBarEnum.exShapeSolidUp;
		Pattern := EXGANTTLib.PatternEnum.exPatternSolid;
	end;
	with Chart.Bars.Add('B') do
	begin
		Color := $80;
		Shape := EXGANTTLib.ShapeBarEnum.exShapeSolidDown;
		Pattern := EXGANTTLib.PatternEnum.exPatternSolid;
	end;
	Chart.Bars.Add('A%B').Shortcut := 'AB';
	with Items do
	begin
		h := AddItem('Task 1');
		AddBar(h,'AB','1/2/2001','1/6/2001','K1',Nil);
		ItemBar[h,'K1',EXGANTTLib.ItemBarPropertyEnum.exBarPercent] := TObject(1);
	end;
	EndUpdate();
end
|
|
667
|
Does your control support RightToLeft property for RTL languages or right to left
with AxGantt1 do
begin
	BeginUpdate();
	ScrollBars := EXGANTTLib.ScrollBarsEnum.exDisableBoth;
	LinesAtRoot := EXGANTTLib.LinesAtRootEnum.exLinesAtRoot;
	with (Columns.Add('P1') as EXGANTTLib.Column) do
	begin
		Def[EXGANTTLib.DefColumnEnum.exCellHasCheckBox] := TObject(True);
		PartialCheck := True;
	end;
	with Items do
	begin
		h := AddItem('Root');
		InsertItem(h,Nil,'Child 1');
		InsertItem(h,Nil,'Child 2');
		ExpandItem[h] := True;
	end;
	RightToLeft := True;
	EndUpdate();
end
|
|
666
|
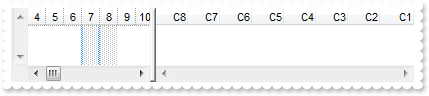
Is there any way to display the vertical scroll bar on the left side, as I want to align my data to the right
with AxGantt1 do
begin
	BeginUpdate();
	ScrollBars := EXGANTTLib.ScrollBarsEnum.exDisableBoth;
	with Columns do
	begin
		Add('C1');
		Add('C2');
		Add('C3');
		Add('C4');
		Add('C5');
		Add('C6');
		Add('C7');
		Add('C8');
	end;
	RightToLeft := True;
	EndUpdate();
end
|
|
665
|
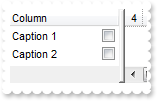
Can I display the cell's check box after the text
with AxGantt1 do
begin
	with (Columns.Add('Column') as EXGANTTLib.Column) do
	begin
		Def[EXGANTTLib.DefColumnEnum.exCellHasCheckBox] := TObject(True);
		Def[EXGANTTLib.DefColumnEnum.exCellDrawPartsOrder] := 'caption,check';
	end;
	with Items do
	begin
		CellHasCheckBox[TObject(AddItem('Caption 1')),TObject(0)] := True;
		CellHasCheckBox[TObject(AddItem('Caption 2')),TObject(0)] := True;
	end;
end
|
|
664
|
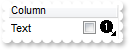
Can I change the order of the parts in the cell, as checkbox after the text, and so on
with AxGantt1 do
begin
	Images('gBJJgBAIDAAGAAEAAQhYAf8Pf4hh0QihCJo2AEZjQAjEZFEaIEaEEaAIAkcbk0olUrlktl0vmExmUzmk1m03nE5nU7nk9n0/oFBoVDolFo1HpFJpVLplNp1PqFRqVTql' +
	'Vq1XrFZrVbrldr1fsFhsVjslls1ntFptVrtltt1vuFxuVzul1u13vF5vV7vl9v1/wGBwWDwmFw2HxGJxWLxmNx0xiFdyOTh8Tf9ZymXx+QytcyNgz8r0OblWjyWds+m0' +
	'ka1Vf1ta1+r1mos2xrG2xeZ0+a0W0qOx3GO4NV3WeyvD2XJ5XL5nN51aiw+lfSj0gkUkAEllHanHI5j/cHg8EZf7w8vl8j4f/qfEZeB09/vjLAB30+kZQAP/P5/H6/yN' +
	'AOAEAwCjMBwFAEDwJBMDwLBYAP2/8Hv8/gAGAD8LQs9w/nhDY/oygIA=');
	(Columns.Add('Column') as EXGANTTLib.Column).Def[EXGANTTLib.DefColumnEnum.exCellDrawPartsOrder] := 'caption,check,icon,icons,picture';
	with Items do
	begin
		h := AddItem('Text');
		CellImage[TObject(h),TObject(0)] := 1;
		CellHasCheckBox[TObject(h),TObject(0)] := True;
	end;
end
|
|
663
|
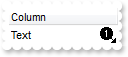
Can I have an image displayed after the text. Can I get that effect without using HTML content
with AxGantt1 do
begin
	Images('gBJJgBAIDAAGAAEAAQhYAf8Pf4hh0QihCJo2AEZjQAjEZFEaIEaEEaAIAkcbk0olUrlktl0vmExmUzmk1m03nE5nU7nk9n0/oFBoVDolFo1HpFJpVLplNp1PqFRqVTql' +
	'Vq1XrFZrVbrldr1fsFhsVjslls1ntFptVrtltt1vuFxuVzul1u13vF5vV7vl9v1/wGBwWDwmFw2HxGJxWLxmNx0xiFdyOTh8Tf9ZymXx+QytcyNgz8r0OblWjyWds+m0' +
	'ka1Vf1ta1+r1mos2xrG2xeZ0+a0W0qOx3GO4NV3WeyvD2XJ5XL5nN51aiw+lfSj0gkUkAEllHanHI5j/cHg8EZf7w8vl8j4f/qfEZeB09/vjLAB30+kZQAP/P5/H6/yN' +
	'AOAEAwCjMBwFAEDwJBMDwLBYAP2/8Hv8/gAGAD8LQs9w/nhDY/oygIA=');
	(Columns.Add('Column') as EXGANTTLib.Column).Def[EXGANTTLib.DefColumnEnum.exCellDrawPartsOrder] := 'caption,icon,check,icons,picture';
	with Items do
	begin
		h := AddItem('Text');
		CellImage[TObject(h),TObject(0)] := 1;
	end;
end
|
|
662
|
Is there any option to print the columns section on each page
with AxGantt1 do
begin
	BeginUpdate();
	Columns.Add('Col 1');
	Columns.Add('Col 2');
	MarkSearchColumn := False;
	Chart.FirstVisibleDate := '1/1/2001';
	Chart.LevelCount := 2;
	with Items do
	begin
		h1 := AddItem('Col 1');
		CellCaption[TObject(h1),TObject(1)] := 'Col 2';
		AddBar(h1,'Task','1/2/2001','1/4/2001','K1',Nil);
		h2 := AddItem('Col 1');
		CellCaption[TObject(h2),TObject(1)] := 'Col 2';
		AddBar(h2,'Task','2/5/2001','2/7/2001','K2',Nil);
		AddLink('L1',h1,'K1',h2,'K2');
		Link['L1',EXGANTTLib.LinkPropertyEnum.exLinkStartPos] := TObject(0);
	end;
	EndUpdate();
	with (ComObj.CreateComObject(ComObj.ProgIDToClassID('Exontrol.Print')) as EXPRINTLib.Print) do
	begin
		Options := 'ColumnsOnEveryPage=-2';
		PrintExt := (AxGantt1.GetOcx() as EXGANTTLib.Gantt).DefaultDispatch;
		Preview();
	end;
end
|
|
661
|
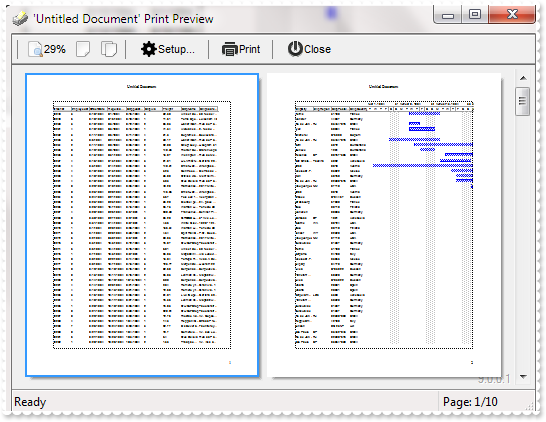
Is there any option to print the columns section on each page
with AxGantt1 do
begin
	BeginUpdate();
	Columns.Add('Task');
	Chart.FirstVisibleDate := '1/1/2001';
	Chart.LevelCount := 2;
	with Items do
	begin
		h1 := AddItem('Task 1');
		AddBar(h1,'Task','1/2/2001','1/4/2001','K1',Nil);
		h2 := AddItem('Task 2');
		AddBar(h2,'Task','2/5/2001','2/7/2001','K2',Nil);
		AddLink('L1',h1,'K1',h2,'K2');
		Link['L1',EXGANTTLib.LinkPropertyEnum.exLinkStartPos] := TObject(0);
	end;
	EndUpdate();
	with (ComObj.CreateComObject(ComObj.ProgIDToClassID('Exontrol.Print')) as EXPRINTLib.Print) do
	begin
		Options := 'ColumnsOnEveryPage=1';
		PrintExt := (AxGantt1.GetOcx() as EXGANTTLib.Gantt).DefaultDispatch;
		Preview();
	end;
end
|
|
660
|
How do I print the control's content
with AxGantt1 do
begin
	BeginUpdate();
	Columns.Add('Task');
	Chart.FirstVisibleDate := '1/1/2001';
	with Items do
	begin
		h1 := AddItem('Task 1');
		AddBar(h1,'Task','1/2/2001','1/4/2001','K1',Nil);
		h2 := AddItem('Task 2');
		AddBar(h2,'Task','1/5/2001','1/7/2001','K2',Nil);
		AddLink('L1',h1,'K1',h2,'K2');
		Link['L1',EXGANTTLib.LinkPropertyEnum.exLinkStartPos] := TObject(0);
	end;
	EndUpdate();
	with (ComObj.CreateComObject(ComObj.ProgIDToClassID('Exontrol.Print')) as EXPRINTLib.Print) do
	begin
		PrintExt := (AxGantt1.GetOcx() as EXGANTTLib.Gantt).DefaultDispatch;
		Preview();
	end;
end
|
|
659
|
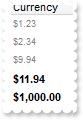
How can I display the column using currency format and enlarge the font for certain values
with AxGantt1 do
begin
	with (Columns.Add('Currency') as EXGANTTLib.Column) do
	begin
		Def[EXGANTTLib.DefColumnEnum.exCellCaptionFormat] := TObject(1);
		FormatColumn := 'len(value) ? ((0:=dbl(value)) < 10 ? ''<fgcolor=808080><font ;7>'' : ''<b>'') + currency(=:0)';
	end;
	with Items do
	begin
		AddItem('1.23');
		AddItem('2.34');
		AddItem('9.94');
		AddItem('11.94');
		AddItem('1000');
	end;
end
|
|
658
|
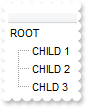
How can I highlight only parts of the cells

with AxGantt1 do
begin
	with (Columns.Add('') as EXGANTTLib.Column) do
	begin
		Def[EXGANTTLib.DefColumnEnum.exCellCaptionFormat] := TObject(1);
		FormatColumn := 'value replace ''hil'' with ''<fgcolor=FF0000><b>hil</b></fgcolor>''';
	end;
	with Items do
	begin
		h := AddItem('Root');
		InsertItem(h,Nil,'Child 1');
		InsertItem(h,Nil,'Child 2');
		InsertItem(h,Nil,'Child 3');
		ExpandItem[h] := True;
	end;
end
|
|
657
|
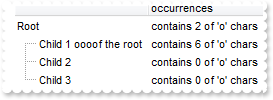
How can I get the number of occurrences of a specified string in the cell
with AxGantt1 do
begin
	Columns.Add('');
	with (Columns.Add('occurrences') as EXGANTTLib.Column) do
	begin
		ComputedField := 'lower(%0) count ''o''';
		FormatColumn := '''contains '' + value + '' of \''o\'' chars''';
	end;
	with Items do
	begin
		h := AddItem('Root');
		InsertItem(h,Nil,'Child 1 oooof the root');
		InsertItem(h,Nil,'Child 2');
		InsertItem(h,Nil,'Child 3');
		ExpandItem[h] := True;
	end;
end
|
|
656
|
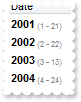
How can I display dates in my format
with AxGantt1 do
begin
	with (Columns.Add('Date') as EXGANTTLib.Column) do
	begin
		Def[EXGANTTLib.DefColumnEnum.exCellCaptionFormat] := TObject(1);
		FormatColumn := '''<b>'' + year(0:=date(value)) + ''</b><fgcolor=808080><font ;6> ('' + month(=:0) + '' - '' + day(=:0) +'')''';
	end;
	with Items do
	begin
		AddItem('1/21/2001');
		AddItem('2/22/2002');
		AddItem('3/13/2003');
		AddItem('4/24/2004');
	end;
end
|
|
655
|
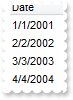
How can I display dates in short format
with AxGantt1 do
begin
	(Columns.Add('Date') as EXGANTTLib.Column).FormatColumn := 'shortdate(value)';
	with Items do
	begin
		AddItem('1/1/2001');
		AddItem('2/2/2002');
		AddItem('3/3/2003');
		AddItem('4/4/2004');
	end;
end
|
|
654
|
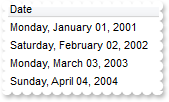
How can I display dates in long format
with AxGantt1 do
begin
	(Columns.Add('Date') as EXGANTTLib.Column).FormatColumn := 'longdate(value)';
	with Items do
	begin
		AddItem('1/1/2001');
		AddItem('2/2/2002');
		AddItem('3/3/2003');
		AddItem('4/4/2004');
	end;
end
|
|
653
|
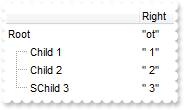
How can I display only the right part of the cell
with AxGantt1 do
begin
	Columns.Add('');
	with (Columns.Add('Right') as EXGANTTLib.Column) do
	begin
		ComputedField := '%0 right 2';
		FormatColumn := '''"'' + value + ''"''';
	end;
	with Items do
	begin
		h := AddItem('Root');
		InsertItem(h,Nil,'Child 1');
		InsertItem(h,Nil,'Child 2');
		InsertItem(h,Nil,'SChild 3');
		ExpandItem[h] := True;
	end;
end
|
|
652
|
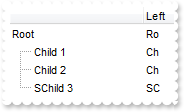
How can I display only the left part of the cell
with AxGantt1 do
begin
	Columns.Add('');
	(Columns.Add('Left') as EXGANTTLib.Column).ComputedField := '%0 left 2';
	with Items do
	begin
		h := AddItem('Root');
		InsertItem(h,Nil,'Child 1');
		InsertItem(h,Nil,'Child 2');
		InsertItem(h,Nil,'SChild 3');
		ExpandItem[h] := True;
	end;
end
|
|
651
|
How can I display true or false instead 0 and -1

with AxGantt1 do
begin
	(Columns.Add('Boolean') as EXGANTTLib.Column).FormatColumn := 'value != 0 ? ''true'' : ''false''';
	with Items do
	begin
		AddItem(TObject(True));
		AddItem(TObject(False));
		AddItem(TObject(True));
		AddItem(TObject(0));
		AddItem(TObject(1));
	end;
end
|
|
650
|
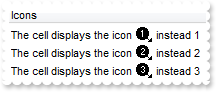
How can I display icons or images instead numbers
with AxGantt1 do
begin
	Images('gBJJgBAIDAAGAAEAAQhYAf8Pf4hh0QihCJo2AEZjQAjEZFEaIEaEEaAIAkcbk0olUrlktl0vmExmUzmk1m03nE5nU7nk9n0/oFBoVDolFo1HpFJpVLplNp1PqFRqVTql' +
	'Vq1XrFZrVbrldr1fsFhsVjslls1ntFptVrtltt1vuFxuVzul1u13vF5vV7vl9v1/wGBwWDwmFw2HxGJxWLxmNx0xiFdyOTh8Tf9ZymXx+QytcyNgz8r0OblWjyWds+m0' +
	'ka1Vf1ta1+r1mos2xrG2xeZ0+a0W0qOx3GO4NV3WeyvD2XJ5XL5nN51aiw+lfSj0gkUkAEllHanHI5j/cHg8EZf7w8vl8j4f/qfEZeB09/vjLAB30+kZQAP/P5/H6/yN' +
	'AOAEAwCjMBwFAEDwJBMDwLBYAP2/8Hv8/gAGAD8LQs9w/nhDY/oygIA=');
	with (Columns.Add('Icons') as EXGANTTLib.Column) do
	begin
		Def[EXGANTTLib.DefColumnEnum.exCellCaptionFormat] := TObject(1);
		FormatColumn := '''The cell displays the icon <img>''+value+''</img> instead '' + value';
	end;
	with Items do
	begin
		AddItem(TObject(1));
		AddItem(TObject(2));
		AddItem(TObject(3));
	end;
end
|
|
649
|
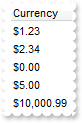
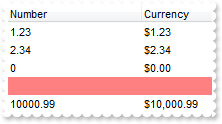
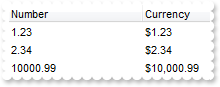
How can I display the column using currency
with AxGantt1 do
begin
	(Columns.Add('Currency') as EXGANTTLib.Column).FormatColumn := 'currency(dbl(value))';
	with Items do
	begin
		AddItem('1.23');
		AddItem('2.34');
		AddItem('0');
		AddItem(TObject(5));
		AddItem('10000.99');
	end;
end
|
|
648
|
How can I display the currency only for not empty cells
with AxGantt1 do
begin
	Columns.Add('Number');
	(Columns.Add('Currency') as EXGANTTLib.Column).ComputedField := 'len(%0) ? currency(dbl(%0)) : ''''';
	with Items do
	begin
		AddItem('1.23');
		AddItem('2.34');
		AddItem('0');
		ItemBackColor[AddItem(Nil)] := $8080ff;
		AddItem('10000.99');
	end;
end
|
|
647
|
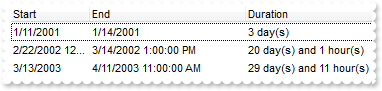
Is there a function to display the number of days between two date including the number of hours
with AxGantt1 do
begin
	(Columns.Add('Start') as EXGANTTLib.Column).Width := 32;
	Columns.Add('End');
	(Columns.Add('Duration') as EXGANTTLib.Column).ComputedField := '2:=((1:=int(0:= date(%1)-date(%0))) = 0 ? '''' : str(=:1) + '' day(s)'') + ( 3:=round(24*(=:0-floor(=:0))) ? (len(=:2) ? '' and '' : ''' +
	''') + =:3 + '' hour(s)'' : '''' )';
	with Items do
	begin
		h := AddItem('1/11/2001');
		CellCaption[TObject(h),TObject(1)] := '1/14/2001';
		h := AddItem('2/22/2002 12:00:00 PM');
		CellCaption[TObject(h),TObject(1)] := '3/14/2002 1:00:00 PM';
		h := AddItem('3/13/2003');
		CellCaption[TObject(h),TObject(1)] := '4/11/2003 11:00:00 AM';
	end;
end
|
|
646
|
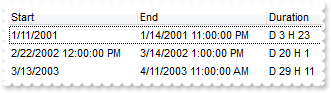
Is there a function to display the number of days between two date including the number of hours
with AxGantt1 do
begin
	Columns.Add('Start');
	Columns.Add('End');
	(Columns.Add('Duration') as EXGANTTLib.Column).ComputedField := '"D " + int(date(%1)-date(%0)) + " H " + round(24*(date(%1)-date(%0) - floor(date(%1)-date(%0))))';
	with Items do
	begin
		h := AddItem('1/11/2001');
		CellCaption[TObject(h),TObject(1)] := '1/14/2001 11:00:00 PM';
		h := AddItem('2/22/2002 12:00:00 PM');
		CellCaption[TObject(h),TObject(1)] := '3/14/2002 1:00:00 PM';
		h := AddItem('3/13/2003');
		CellCaption[TObject(h),TObject(1)] := '4/11/2003 11:00:00 AM';
	end;
end
|
|
645
|
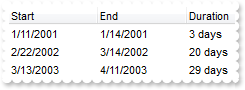
How can I display the number of days between two dates
with AxGantt1 do
begin
	Columns.Add('Start');
	Columns.Add('End');
	(Columns.Add('Duration') as EXGANTTLib.Column).ComputedField := '(date(%1)-date(%0)) + '' days''';
	with Items do
	begin
		h := AddItem('1/11/2001');
		CellCaption[TObject(h),TObject(1)] := '1/14/2001';
		h := AddItem('2/22/2002');
		CellCaption[TObject(h),TObject(1)] := '3/14/2002';
		h := AddItem('3/13/2003');
		CellCaption[TObject(h),TObject(1)] := '4/11/2003';
	end;
end
|
|
644
|
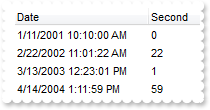
How can I get second part of the date
with AxGantt1 do
begin
	Columns.Add('Date');
	(Columns.Add('Second') as EXGANTTLib.Column).ComputedField := 'sec(date(%0))';
	with Items do
	begin
		AddItem('1/11/2001 10:10:00 AM');
		AddItem('2/22/2002 11:01:22 AM');
		AddItem('3/13/2003 12:23:01 PM');
		AddItem('4/14/2004 1:11:59 PM');
	end;
end
|
|
643
|
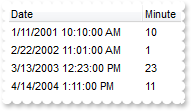
How can I get minute part of the date
with AxGantt1 do
begin
	Columns.Add('Date');
	(Columns.Add('Minute') as EXGANTTLib.Column).ComputedField := 'min(date(%0))';
	with Items do
	begin
		AddItem('1/11/2001 10:10:00 AM');
		AddItem('2/22/2002 11:01:00 AM');
		AddItem('3/13/2003 12:23:00 PM');
		AddItem('4/14/2004 1:11:00 PM');
	end;
end
|
|
642
|
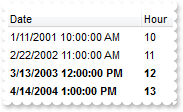
How can I check the hour part only so I know it was afternoon
with AxGantt1 do
begin
	ConditionalFormats.Add('hour(%0)>=12',Nil).Bold := True;
	Columns.Add('Date');
	(Columns.Add('Hour') as EXGANTTLib.Column).ComputedField := 'hour(%0)';
	with Items do
	begin
		AddItem('1/11/2001 10:00:00 AM');
		AddItem('2/22/2002 11:00:00 AM');
		AddItem('3/13/2003 12:00:00 PM');
		AddItem('4/14/2004 1:00:00 PM');
	end;
end
|
|
641
|
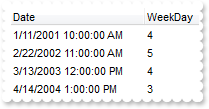
What about a function to get the day in the week, or days since Sunday
with AxGantt1 do
begin
	Columns.Add('Date');
	(Columns.Add('WeekDay') as EXGANTTLib.Column).ComputedField := 'weekday(%0)';
	with Items do
	begin
		AddItem('1/11/2001 10:00:00 AM');
		AddItem('2/22/2002 11:00:00 AM');
		AddItem('3/13/2003 12:00:00 PM');
		AddItem('4/14/2004 1:00:00 PM');
	end;
end
|
|
640
|
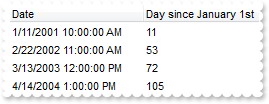
Is there any function to get the day of the year or number of days since January 1st
with AxGantt1 do
begin
	Columns.Add('Date');
	(Columns.Add('Day since January 1st') as EXGANTTLib.Column).ComputedField := 'yearday(%0)';
	with Items do
	begin
		AddItem('1/11/2001 10:00:00 AM');
		AddItem('2/22/2002 11:00:00 AM');
		AddItem('3/13/2003 12:00:00 PM');
		AddItem('4/14/2004 1:00:00 PM');
	end;
end
|
|
639
|
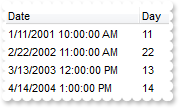
How can I display only the day of the date
with AxGantt1 do
begin
	Columns.Add('Date');
	(Columns.Add('Day') as EXGANTTLib.Column).ComputedField := 'day(%0)';
	with Items do
	begin
		AddItem('1/11/2001 10:00:00 AM');
		AddItem('2/22/2002 11:00:00 AM');
		AddItem('3/13/2003 12:00:00 PM');
		AddItem('4/14/2004 1:00:00 PM');
	end;
end
|
|
638
|
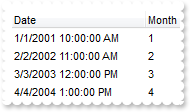
How can I display only the month of the date
with AxGantt1 do
begin
	Columns.Add('Date');
	(Columns.Add('Month') as EXGANTTLib.Column).ComputedField := 'month(%0)';
	with Items do
	begin
		AddItem('1/1/2001 10:00:00 AM');
		AddItem('2/2/2002 11:00:00 AM');
		AddItem('3/3/2003 12:00:00 PM');
		AddItem('4/4/2004 1:00:00 PM');
	end;
end
|
|
637
|
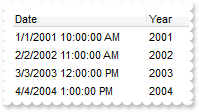
How can I get only the year part from a date expression
with AxGantt1 do
begin
	Columns.Add('Date');
	(Columns.Add('Year') as EXGANTTLib.Column).ComputedField := 'year(%0)';
	with Items do
	begin
		AddItem('1/1/2001 10:00:00 AM');
		AddItem('2/2/2002 11:00:00 AM');
		AddItem('3/3/2003 12:00:00 PM');
		AddItem('4/4/2004 1:00:00 PM');
	end;
end
|
|
636
|
Can I convert the expression to date
with AxGantt1 do
begin
	Columns.Add('Number');
	(Columns.Add('Date') as EXGANTTLib.Column).ComputedField := 'date(dbl(%0))';
	with Items do
	begin
		AddItem('-1.98');
		AddItem('30000.99');
		AddItem('3561.23');
		AddItem('1232.34');
	end;
end
|
|
635
|
Can I convert the expression to a number, double or float
with AxGantt1 do
begin
	Columns.Add('Number');
	(Columns.Add('Number + 2') as EXGANTTLib.Column).ComputedField := 'dbl(%0)+2';
	with Items do
	begin
		AddItem('-1.98');
		AddItem('0.99');
		AddItem('1.23');
		AddItem('2.34');
	end;
end
|
|
634
|
How can I display dates in long format
with AxGantt1 do
begin
	Columns.Add('Date');
	(Columns.Add('LongFormat') as EXGANTTLib.Column).ComputedField := 'longdate(%0)';
	with Items do
	begin
		AddItem('1/1/2001 10:00:00 AM');
		AddItem('2/2/2002 11:00:00 AM');
		AddItem('3/3/2003 12:00:00 PM');
		AddItem('4/4/2004 1:00:00 PM');
	end;
end
|
|
633
|
How can I display dates in short format
with AxGantt1 do
begin
	Columns.Add('Date');
	(Columns.Add('ShortFormat') as EXGANTTLib.Column).ComputedField := 'shortdate(%0)';
	with Items do
	begin
		AddItem('1/1/2001 10:00:00 AM');
		AddItem('2/2/2002 11:00:00 AM');
		AddItem('3/3/2003 12:00:00 PM');
		AddItem('4/4/2004 1:00:00 PM');
	end;
end
|
|
632
|
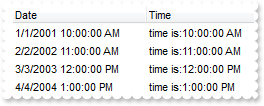
How can I display the time only of a date expression
with AxGantt1 do
begin
	Columns.Add('Date');
	(Columns.Add('Time') as EXGANTTLib.Column).ComputedField := '''time is:'' + time(date(%0))';
	with Items do
	begin
		AddItem('1/1/2001 10:00:00 AM');
		AddItem('2/2/2002 11:00:00 AM');
		AddItem('3/3/2003 12:00:00 PM');
		AddItem('4/4/2004 1:00:00 PM');
	end;
end
|
|
631
|
Is there any function to display currencies, or money formatted as in the control panel
with AxGantt1 do
begin
	Columns.Add('Number');
	(Columns.Add('Currency') as EXGANTTLib.Column).ComputedField := 'currency(dbl(%0))';
	with Items do
	begin
		AddItem('1.23');
		AddItem('2.34');
		AddItem('10000.99');
	end;
end
|
|
630
|
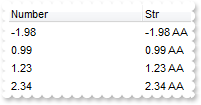
How can I convert the expression to a string so I can look into the date string expression for month's name
with AxGantt1 do
begin
	Columns.Add('Number');
	(Columns.Add('Str') as EXGANTTLib.Column).ComputedField := 'str(%0) + '' AA''';
	with Items do
	begin
		AddItem('-1.98');
		AddItem('0.99');
		AddItem('1.23');
		AddItem('2.34');
	end;
end
|
|
629
|
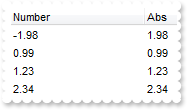
Can I display the absolute value or positive part of the number
with AxGantt1 do
begin
	Columns.Add('Number');
	(Columns.Add('Abs') as EXGANTTLib.Column).ComputedField := 'abs(%0)';
	with Items do
	begin
		AddItem('-1.98');
		AddItem('0.99');
		AddItem('1.23');
		AddItem('2.34');
	end;
end
|
|
628
|
Is there any function to get largest number with no fraction part that is not greater than the value
with AxGantt1 do
begin
	Columns.Add('Number');
	(Columns.Add('Floor') as EXGANTTLib.Column).ComputedField := 'floor(%0)';
	with Items do
	begin
		AddItem('-1.98');
		AddItem('0.99');
		AddItem('1.23');
		AddItem('2.34');
	end;
end
|
|
627
|
Is there any function to round the values base on the .5 value
with AxGantt1 do
begin
	Columns.Add('Number');
	(Columns.Add('Round') as EXGANTTLib.Column).ComputedField := 'round(%0)';
	with Items do
	begin
		AddItem('-1.98');
		AddItem('0.99');
		AddItem('1.23');
		AddItem('2.34');
	end;
end
|
|
626
|
How can I get or display the integer part of the cell
with AxGantt1 do
begin
	Columns.Add('Number');
	(Columns.Add('Int') as EXGANTTLib.Column).ComputedField := 'int(%0)';
	with Items do
	begin
		AddItem('-1.98');
		AddItem('0.99');
		AddItem('1.23');
		AddItem('2.34');
	end;
end
|
|
625
|
How can I display names as proper ( first leter of the word must be in uppercase, and the rest in lowercase )
with AxGantt1 do
begin
	(Columns.Add('') as EXGANTTLib.Column).ComputedField := 'proper(%0)';
	with Items do
	begin
		h := AddItem('root');
		InsertItem(h,Nil,'child child');
		InsertItem(h,Nil,'child child');
		InsertItem(h,Nil,'child child');
		ExpandItem[h] := True;
	end;
end
|
|
624
|
Is there any option to display cells in uppercase
with AxGantt1 do
begin
	(Columns.Add('') as EXGANTTLib.Column).ComputedField := 'upper(%0)';
	with Items do
	begin
		h := AddItem('Root');
		InsertItem(h,Nil,'Child 1');
		InsertItem(h,Nil,'Child 2');
		InsertItem(h,Nil,'Chld 3');
		ExpandItem[h] := True;
	end;
end
|
|
623
|
Is there any option to display cells in lowercase

with AxGantt1 do
begin
	(Columns.Add('') as EXGANTTLib.Column).ComputedField := 'lower(%0)';
	with Items do
	begin
		h := AddItem('Root');
		InsertItem(h,Nil,'Child 1');
		InsertItem(h,Nil,'Child 2');
		InsertItem(h,Nil,'Chld 3');
		ExpandItem[h] := True;
	end;
end
|
|
622
|
How can I mark the cells that has a specified type, ie strings only

with AxGantt1 do
begin
	ConditionalFormats.Add('type(%0) = 8',Nil).ForeColor := $ff;
	Columns.Add('');
	with Items do
	begin
		h := AddItem('Root');
		InsertItem(h,Nil,'Child 1');
		InsertItem(h,Nil,TObject(2));
		InsertItem(h,Nil,'Chld 3');
		ExpandItem[h] := True;
	end;
end
|
|
621
|
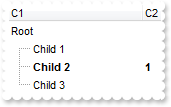
How can I bold the items that contains data or those who displays empty strings
with AxGantt1 do
begin
	ConditionalFormats.Add('not len(%1)=0',Nil).Bold := True;
	Columns.Add('C1');
	Columns.Add('C2');
	with Items do
	begin
		h := AddItem('Root');
		InsertItem(h,Nil,'Child 1');
		hC := InsertItem(h,Nil,'Child 2');
		CellCaption[TObject(hC),TObject(1)] := '1';
		InsertItem(h,Nil,'Child 3');
		ExpandItem[h] := True;
	end;
end
|
|
620
|
Can I change the background color for items or cells that contains a specified string

with AxGantt1 do
begin
	ConditionalFormats.Add('%0 contains ''hi''',Nil).BackColor := $ff;
	Columns.Add('');
	with Items do
	begin
		h := AddItem('Root');
		InsertItem(h,Nil,'Child 1');
		InsertItem(h,Nil,'Child 2');
		InsertItem(h,Nil,'Chld 3');
		ExpandItem[h] := True;
	end;
end
|
|
619
|
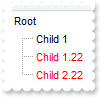
Is there any option to change the fore color for cells or items that ends with a specified string
with AxGantt1 do
begin
	ConditionalFormats.Add('%0 endwith ''22''',Nil).ForeColor := $ff;
	Columns.Add('');
	with Items do
	begin
		h := AddItem('Root');
		InsertItem(h,Nil,'Child 1');
		InsertItem(h,Nil,'Child 1.22');
		InsertItem(h,Nil,'Child 2.22');
		ExpandItem[h] := True;
	end;
end
|
|
618
|
How can I highlight the cells or items that starts with a specified string

with AxGantt1 do
begin
	ConditionalFormats.Add('%0 startwith ''C''',Nil).Underline := True;
	Columns.Add('');
	with Items do
	begin
		h := AddItem('Root');
		InsertItem(h,Nil,'Child 1');
		InsertItem(h,Nil,'Child 2');
		InsertItem(h,Nil,'SChild 3');
		ExpandItem[h] := True;
	end;
end
|
|
617
|
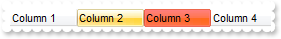
How can I change the background color or the visual appearance using ebn for a particular column
with AxGantt1 do
begin
	VisualAppearance.Add(1,'c:\exontrol\images\normal.ebn');
	with Columns do
	begin
		Add('Column 1');
		(Add('Column 2') as EXGANTTLib.Column).Def[EXGANTTLib.DefColumnEnum.exHeaderBackColor] := TObject(16777216);
		(Add('Column 3') as EXGANTTLib.Column).Def[EXGANTTLib.DefColumnEnum.exHeaderBackColor] := TObject(16777471);
		Add('Column 4');
	end;
end
|
|
616
|
How can I change the background color for a particular column
with AxGantt1 do
begin
	with Columns do
	begin
		Add('Column 1');
		(Add('Column 2') as EXGANTTLib.Column).Def[EXGANTTLib.DefColumnEnum.exHeaderBackColor] := TObject(8439039);
		Add('Column 3');
	end;
end
|
|
615
|
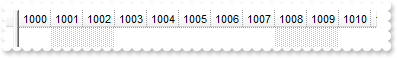
Is it possible to define level in terms of just increasing numbers (not a Date)
with AxGantt1 do
begin
	with Chart do
	begin
		PaneWidth[False] := 32;
		UnitWidth := 32;
		FirstVisibleDate := TObject(1000);
		Level[0].Label := '<%i%>';
	end;
end
|
|
614
|
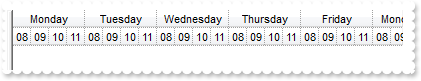
How can I hide the non-working units ( days or hours )
with AxGantt1 do
begin
	BeginUpdate();
	with Chart do
	begin
		PaneWidth[False] := 0;
		LevelCount := 2;
		with Level[0] do
		begin
			Label := '<%dddd%>';
			Alignment := EXGANTTLib.AlignmentEnum.CenterAlignment;
		end;
		Level[1].Label := TObject(65536);
		NonworkingHours := 16773375;
		ShowNonworkingUnits := False;
	end;
	EndUpdate();
end
|
|
613
|
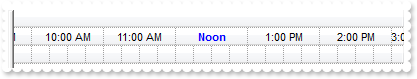
Is there a way to have the display show the word "Noon" instead "12:00 PM" in the chart's header/levels
with AxGantt1 do
begin
	with Chart do
	begin
		PaneWidth[False] := 0;
		FirstVisibleDate := '1/1/2001 10:00:00 AM';
		LevelCount := 3;
		with Level[0] do
		begin
			Label := '<b><%mmm%> <%d%>, <%yyyy%></b>';
			Alignment := EXGANTTLib.AlignmentEnum.CenterAlignment;
			Unit := EXGANTTLib.UnitEnum.exDay;
		end;
		with Level[1] do
		begin
			Label := '<%h%>:00 <%AM/PM%>';
			Alignment := EXGANTTLib.AlignmentEnum.CenterAlignment;
			Unit := EXGANTTLib.UnitEnum.exHour;
			DrawTickLines := True;
			DrawGridLines := True;
			ReplaceLabel['12:00 PM'] := '<fgcolor=0000FF><b>Noon</b></fgcolor>';
		end;
		with Level[2] do
		begin
			Label := '';
			Unit := EXGANTTLib.UnitEnum.exMinute;
			Count := 15;
		end;
	end;
end
|
|
612
|
How can I change the selection background color in the chart area
with AxGantt1 do
begin
	Chart.FirstVisibleDate := '1/1/2001';
	Chart.SelBackColor := $ff;
	Columns.Add('Column');
	with Items do
	begin
		AddBar(AddItem('Item 1'),'Task','1/2/2001','1/4/2001',Nil,Nil);
		AddBar(AddItem('Item 1'),'Task','1/6/2001','1/14/2001',Nil,Nil);
		SelectItem[FirstVisibleItem] := True;
	end;
end
|
|
611
|
How can I change the selection background color in the chart area
with AxGantt1 do
begin
	VisualAppearance.Add(1,'c:\exontrol\images\normal.ebn');
	Chart.FirstVisibleDate := '1/1/2001';
	Chart.SelBackColor := $1000000;
	Columns.Add('Column');
	with Items do
	begin
		AddBar(AddItem('Item 1'),'Task','1/2/2001','1/4/2001',Nil,Nil);
		AddBar(AddItem('Item 1'),'Task','1/6/2001','1/14/2001',Nil,Nil);
		SelectItem[FirstVisibleItem] := True;
	end;
end
|
|
610
|
Is there any way to extend the selection on the chart
with AxGantt1 do
begin
	Chart.FirstVisibleDate := '1/1/2001';
	Chart.SelBackColor := AxGantt1.SelBackColor;
	Columns.Add('Column');
	with Items do
	begin
		AddBar(AddItem('Item 1'),'Task','1/2/2001','1/4/2001',Nil,Nil);
		AddBar(AddItem('Item 1'),'Task','1/6/2001','1/14/2001',Nil,Nil);
		SelectItem[FirstVisibleItem] := True;
	end;
end
|
|
609
|
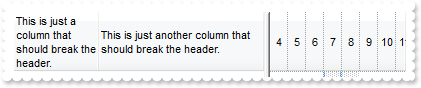
How can I display the column's header using multiple lines
with AxGantt1 do
begin
	HeaderHeight := 128;
	HeaderSingleLine := False;
	(Columns.Add('This is just a column that should break the header.') as EXGANTTLib.Column).Width := 32;
	Columns.Add('This is just another column that should break the header.');
end
|
|
608
|
How can change the width, transparency, style, visual appearance ( EBN), of the vertical bar that shows the current date-time
with AxGantt1 do
begin
	VisualAppearance.Add(1,'c:\exontrol\images\normal.ebn');
	with Chart do
	begin
		LevelCount := 2;
		Level[0].Label := TObject(1048576);
		with Level[1] do
		begin
			Label := '<%ss%>';
			Count := 15;
		end;
		MarkNowColor := $1000000;
		MarkNowWidth := 6;
		MarkNowTransparent := 50;
	end;
	Columns.Add('Tasks');
	with Items do
	begin
		AddBar(AddItem('Item 1'),'Task','1/1/2008','1/1/2018',Nil,Nil);
	end;
end
|
|
607
|
How can change the width, style, visual appearance ( EBN), of the vertical bar that shows the current time
with AxGantt1 do
begin
	VisualAppearance.Add(1,'c:\exontrol\images\normal.ebn');
	with Chart do
	begin
		LevelCount := 2;
		Level[0].Label := TObject(1048576);
		with Level[1] do
		begin
			Label := '<%ss%>';
			Count := 15;
		end;
		MarkNowColor := $1000000;
		MarkNowWidth := 6;
	end;
	Columns.Add('Tasks');
	with Items do
	begin
		AddBar(AddItem('Item 1'),'Task','1/1/2008','1/1/2018',Nil,Nil);
	end;
end
|
|
606
|
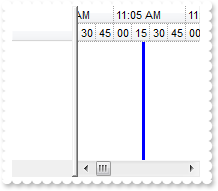
How can I show a vertical bar that indicates the current time
with AxGantt1 do
begin
	with Chart do
	begin
		LevelCount := 2;
		Level[0].Label := TObject(1048576);
		with Level[1] do
		begin
			Label := '<%ss%>';
			Count := 15;
		end;
		MarkNowColor := $ff0000;
		MarkNowWidth := 7;
	end;
	Columns.Add('Tasks');
	with Items do
	begin
		AddBar(AddItem('Item 1'),'Task','1/1/2008','1/1/2018',Nil,Nil);
	end;
end
|
|
605
|
How can I show semi-transparent the vertical bar that indicates the current time
with AxGantt1 do
begin
	with Chart do
	begin
		LevelCount := 2;
		Level[0].Label := TObject(1048576);
		with Level[1] do
		begin
			Label := '<%ss%>';
			Count := 15;
		end;
		MarkNowColor := $ff0000;
		MarkNowWidth := 7;
		MarkNowTransparent := 50;
	end;
	Columns.Add('Tasks');
	with Items do
	begin
		AddBar(AddItem('Item 1'),'Task','1/1/2008','1/1/2018',Nil,Nil);
	end;
end
|
|
604
|
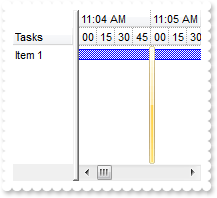
Is there any way to highlight or show a vertical bar that indicates the current time, from 15 to 15 seconds
with AxGantt1 do
begin
	Chart.LevelCount := 2;
	Chart.Level[0].Label := TObject(1048576);
	with Chart.Level[1] do
	begin
		Label := '<%ss%>';
		Count := 15;
	end;
	Chart.MarkNowColor := $ff0000;
	Chart.MarkNowCount := 15;
	Chart.MarkNowWidth := 3;
end
|
|
603
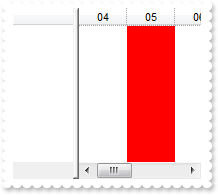
|
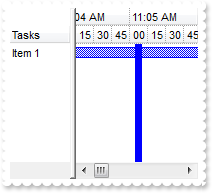
Is there any way to highlight or show a vertical bar that indicates the current time, from minute to minute, hour and so on
with AxGantt1 do
begin
	with Chart do
	begin
		UnitWidth := 48;
		LevelCount := 1;
		Level[0].Label := TObject(1048576);
		MarkNowColor := $ff;
		MarkNowUnit := EXGANTTLib.UnitEnum.exMinute;
		MarkNowWidth := UnitWidth;
	end;
end
|
|
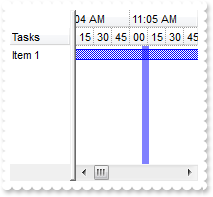
602
|
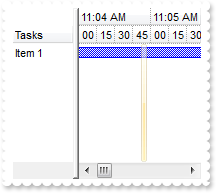
Is there any way to highlight or show a vertical bar that indicates the current time
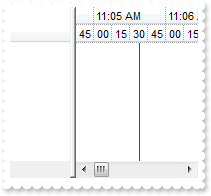
with AxGantt1 do
begin
	Chart.LevelCount := 2;
	Chart.Level[0].Label := TObject(1048576);
	with Chart.Level[1] do
	begin
		Label := '<%ss%>';
		Count := 15;
	end;
	Chart.MarkNowColor := $ff;
end
|
|
601
|
Is there a way of making a bar flash on the screen
with AxGantt1 do
begin
	Columns.Add('Task');
	Chart.FirstVisibleDate := '1/1/2001';
	with Items do
	begin
		h := AddItem('Flashy task');
		AddBar(h,'Task','1/2/2001','1/6/2001','K1',Nil);
		ItemBar[h,'K1',EXGANTTLib.ItemBarPropertyEnum.exBarTransparent] := TObject(80);
	end;
end
|